As with most technologies these days you get plenty of options as to how you solve your technical and logistical problems. The following set of posts details one way you can approach solving what I suspect is quite a common problem – how to usefully aggregate large quantities of logs in the cloud.
What to expect from these blog posts
- Getting started – how to get log data off each box into a search index (this post)
- Keeping the search index under control
- Enriching the data you push into your search index
Some background
Our production infrastructure is composed of roughly 30 windows instances, some web boxes and some sql boxes. These are split between 2 regions and within each region are deployed to all the availability zones that AWS provides. We generate roughly 500k log entries in 15 mins which ends up as 20-25GB log data per day.
The first attempt
When we started out on this work we didn’t appreciate quite how much log data we’d be generating. Our initial setup was based around some CloudFormation templates provided by AWSLabs: https://github.com/awslabs/cloudwatch-logs-subscription-consumer. Initially this worked fine however we quickly hit the issue where the index, and hence kibana, would stop working. We aren’t elasticSearch, kibana or even linux experts here so troubleshooting was taking more time than the benefits we got from the tools.
Getting log data off your instances
As much as the first attempt for querying and displaying log entries didn’t quite work out, we did make good progress as to how we pooled all the log data generated across the infrastructure. You have a few options here – we chose to push everything to CloudWatch and then stream onto other tools.
Note, CloudWatch is a great way of aggregating all your logs however searching across large numbers of log groups and log streams isn’t particularly simple or quick.
To push data into CloudWatch you have a few options:
– Write log entries directly to a known group – e.g. setup a log4net appender that writes directly to CloudWatch
– If you are generating physical log files on disk, use EC2Config (an ootb solution provided by AWS) which streams the data from log files into CloudWatch.
Note, this needs configuring to specify which folders contain the source log files. See http://docs.aws.amazon.com/AWSEC2/latest/WindowsGuide/UsingConfig_WinAMI.html for more info.
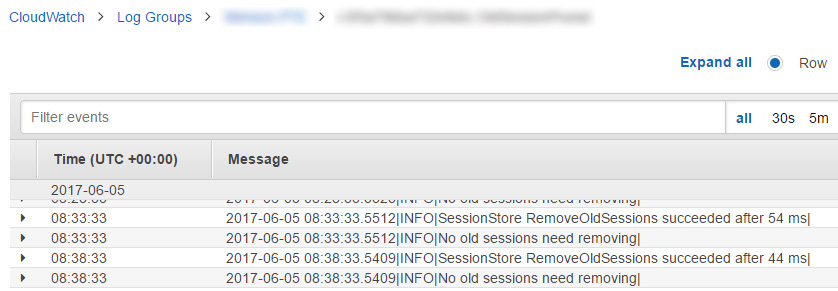
Provided things have gone to plan, you should now start to see log entries show up in CloudWatch:
CloudWatch log group subscribers
CloudWatch allows you to wire up subscribers to log groups – these forward on any log entries to the respective subscriber. Subscribers can be multiple things, either: kinesis streams or to a lambda function. Via the web ui you can select a log group, choose actions then e.g. ‘Stream to AWS Lambda’.
AWS Lambda functions
Lambda functions can be used for many things – in these examples we use them to:
– Transform cloudformation log entries into a format we want to index in ElasticSearch
– Run a nightly cleanup to kill off old search indices
– Run an hourly job to scrape meta data out of EC2 and store into Dynamo
Note, we chose to use the NodeJS runtime – see http://docs.aws.amazon.com/AWSJavaScriptSDK/latest/top-level-namespace.html for the API documentation
ElasticSearch as a service
Our first attempt, ie self hosting, did provide good insight into how things should work but the failure rate was too high. We found we were needing to rebuild the stack every couple weeks. Hence, SAAS was a lot more appealing an option. Let the experts handle the setup.
Note, Troy Hunt has written some good posts on the benefits of pushing as much to SAAS – https://www.troyhunt.com/heres-how-i-deal-with-managed-platform-outages/
Setting up ElasticSearch
This is the cool bit as it can all be done through the AWS UI! The steps to follow are:
- Create an Elasticsearch domain
- Ensure to pick a large enough volume size. We opted for 500GB in our production account
- Select a suitable access policy. We whitelisted our office IP
- This takes a while to rev up so wait until it goes green
- One neat thing is you now get Kibana automatically available. The UI will provide the kibana url.
- Setup a CloudWatch group subscriber
- Find the group you want to push to the index, then ‘Actions’ -> ‘Stream to Amazon Elasticsearch Service’
- Select ‘Other’ for the Log Format
- Complete the wizard, which ultimately will create you a Lambda function
- Start testing things out
- If you now push items into CloudWatch, you should see indices created in ElasticSearch
- Within Kibana you need to let Kibana know how the data looks:
- Visit ‘Management’ -> ‘Index Patterns’ -> ‘Add new’
- The log format is [cwl-]YYYY.MM.DD
Next up we’ll go through:
- How to prune old indices in order to keep a decent level of disk space left
- How to transform the data from CloudWatch, through a Lambda function, into the ElasticSearch index