Customizing logging in a C# dotnetcore AWS Lambda function

One challenge we hit recently was how to build our dotnetcore lambda functions in a consistent way – in particular how would we approach logging.

A pattern we’ve adopted is to write the core functionality for our functions so that it’s as easy to run from a console app as it is from a lambda. The lambda can then be considered only as the entry point to the functionality.

Serverless Dependency injection

I am sure there are different schools of thought here, should you use a container within a serverless function or not? For this post the design assumes you do make use of the Microsoft DependencyInjection libraries.

Setting up your projects

Based on the design mentioned above, ie you can run from functionality as easily from a Console App as you can a lambda, I often setup the following projects:

  • Project.ActualFunctionality (e.g. SnsDemo.Publisher)
  • Project.ActualFunctionality.ConsoleApp (e.g. SnsDemo.Publisher.ConsoleApp)
  • Project.ActualFunctionality.Lambda (e.g. SnsDemo.Publisher.Lambda)

The actual functionality lives in the top project and is shared with both other projects. Dependency injection, and AWS profiles are used to run the functionality locally.

The actual functionality

Let’s assume the functionality for your function does something simple like pushing messages into an SQS queue

The console app version

It’s pretty simple to get DI working in a dotnetcore console app

The lambda version

This looks very similar to the console version

The really interesting bit to take note of is: .AddLogging(a => a.AddProvider(new CustomLambdaLogProvider(context.Logger)))

In the actual functionality we can log in many ways:

To make things lambda agnostic I’d argue injecting ILogger<Type> and then _logger.LogInformation(“_logger Messages sent”); is the preferred option.

Customizing the logger

It’s simple to customize the dotnetcore logging framework – for this demo I setup 2 things. The CustomLambdaLogProvider and the CustomLambdaLogger.

And finally a basic version of the actual logger:

Summary

The aim here is to keep your application code agnostic to where it runs. Using dependency injection we can share core logic between any ‘runner’ e.g. Lambda functions, Azure functions, Console App’s – you name it.

With some small tweaks to the lambda logging calls you can ensure the OTB lambda logger is still used under the hood, but your implementation code can make use of injecting things like ILogger<T> wherever needed 🙂
Automating a multi region deployment with Azure Devops

For a recent project we’ve invested a lot of time into Azure Devops, and in the most part found it a very useful toolset for deploying our code to both Azure and AWS.

When we started on this process, YAML pipelines weren’t available for our source code provider – this meant everything had to be setup manually 🙁

However, recently this has changed 🙂 This post will run through a few ways you can optimize your release process and automate the whole thing.

First a bit of background and then some actual code examples.

Why YAML?

Setting up your pipelines via the UI is a really good way to quickly prototype things, however what if you need to change these pipelines to mimic deployment features alongside code features. Yaml allows you to keep the pipeline definition in the same codebase as the actual features. You deploy branch XXX and that can be configured differently to branch YYY.

Another benefit, the changes are then visible in your pull requests so validating changes is a lot easier.

Async Jobs

A big optimization we gained was to release to different regions in parallel. Yaml makes this very easy by using Jobs – each job can run on an agent and hence push to multiple regions in parallel.

https://docs.microsoft.com/en-us/azure/devops/pipelines/process/phases?view=azure-devops&tabs=yaml

Yaml file templates

If you have common functionality you want to duplicate, e.g. ‘Deploy to Eu-West-1’, templates are a good way to split your functionality. They allow you to group logical functionality you want to run multiple times.

https://docs.microsoft.com/en-us/azure/devops/pipelines/process/templates?view=azure-devops

Azure Devops rest API

All of your build/releases can be triggered via the UI portal, however if you want to automate that process I’d suggest looking into the rest API. Via this you can trigger, monitor and administer builds, releases and a whole load more.

We use powershell to orchestrate the process.

https://docs.microsoft.com/en-us/rest/api/azure/devops/build/builds/queue?view=azure-devops-rest-5.1

Variables, and variable groups

I have to confess, this syntax feels slightly cumbersome, but it’s very possible to reference variables passed into a specific pipeline along with global variables from groups you setup in the Library section of the portal.

Now, some examples

The root YAML file:

The ‘DeployToRegion’ template:

And finally some powershell to fire it all off:

Happy deploying 🙂

AWS Serverless template – inline policies

If you’ve worked with AWS Serverless templates, you’ll appreciate how quickly you can deploy a raft of infrastructure with very little template code. The only flaw I’ve found so far is the documentation is a bit tricky to find.

Say you want to attach some custom policies to your function, you can simply embed them into your template. E.g:

This also shows a few other neat features:

  • Wildcards in the custom policy name, allowing it to work across multiple buckets
  • Cron triggered events
  • How to set environment variables from your template

Serving images through AWS Api Gateway from Serverless Lambda_proxy function

In another post I mentioned the neat features now available in AWS: Serverless templates.

As part of an experiment I thought it would be interesting to see how you could put a light security layer over S3 so that media requests stream from S3 if a user logs in.

The WebApi template  already ships with an S3 proxy controller. Tweaking this slightly allowed me to stream or download the image:

The issue I ran into was accessing images via the endpoint you then get in API Gateway – images were getting encoded so wouldn’t render in the browser.

The solution:

  • In the settings for your api gateway, add the Binary Media Type: */*
  • On the {proxy+} method ‘Method Response’ add a 200 response header and add a header Content-Type. Finally publish your api

The second step here may not be necessary but I found the */* didn’t kick in until I made the change.

PUB SUB in AWS Lambda via SNS using C#

AWS Lambda’s are a great replacement for things like Windows Services which need to run common tasks periodically. A few examples would be triggering scheduled backups or polling urls.

You can set many things as the trigger for a lambda, for scheduled operations this can be a CRON value triggered from a CloudWatch event. Alternatively lambda’s can be triggered via a subscription to an SNS topic.

Depending on the type of operation you want to perform on a schedule you might find it takes longer than the timeout restriction imposed by AWS. If that’s the case then a simple PUB SUB (publisher, subscriber) configuration should help.

Sample scenario

We want to move databases backups between 2 buckets in S3. There are several databases to copy, each of which being a large file.

In one lambda you can easily find all the files to copy but if you also try to copy them all at some point your function will timeout.

Pub sub to the rescue

Why not setup 2 lambda functions? One as the publisher and one as the subscriber, and then glue the two together with an SNS topic (Simple Notification Service)

The publisher

Typically this would be triggered from a schedule and would look to raise events for each operations. Lets assume we use a simple POCO for converying the information we need:

The batching can be ignored if needs be – in this scenario this allows multiple urls to be handled by one subscriber.

The subscriber

Next we need to listen for the messages – you want to configure the subscriber function to have an SNS trigger that uses the same topic you posted to before.

Debugging things
You can either run each function on demand and see any output directly in the Lambda test window, or dig into your cloudwatch logs for each function.

AWS Lambda now supports Serverless applications including WebApi

One of the most exciting areas that I’ve seen emerging in the Cloud space recently is Serverless computing. Both AWS and Azure have their own flavour: AWS Lambda and Azure Functions.

An intro into Serverless

It really does what it says on the tin. You can run code but without dedicated infrastructure that you host. A good example is when building Alexa Skills.

You create AWS lambda function, in most of the languages of your choice, and then deploy into the cloud. Whenever someone uses your skill the lambda gets invoked and returns the content you need.

Behind the scenes AWS host your function in a container, if it receives traffic the container remains hot. If it doesn’t receive traffic its ‘frozen’. There is a very good description of this at https://medium.com/@tjholowaychuk/aws-lambda-lifecycle-and-in-memory-caching-c9cd0844e072

Your language of choice

AWS Lambda supports a raft of languages: Python, Node, Java, .net core and others. Recently this has been upgraded so that it supports .net core 2.

Doing the legwork

With a basic lambda function you can concoct different handlers (methods) which respond to requests. This allows one lambda to service several endpoints. However, you need to do quite a lot of wiring and it doesn’t feel quite like normal WebApi programming.

Enter the serverless applications

This came right out the blue, but was very cool – Amazon released some starter kits that allow you run both RazorPage and WebApi applications in Lambdas!!! https://aws.amazon.com/blogs/developer/serverless-asp-net-core-2-0-applications/

Woah, you can write normal WebApi and deploy into a lambda. That is big.

Quick, migrate all the things

So I tried this. And in the most part everything worked pretty seamlessly. All the code I’d already written easily mapped into WebApi controllers I could then run locally. Tick.

Deploying was simple, either via Visual Studio or the dotnet lambda tools. Tick.

Using the serverless.template that ships with the starter pack it even setup my Api Gateway. Tick.

Dependency injection thats inherently available in .net core all worked. Tick.

WebApi attribute routing all works. Tick.

So far so good right 🙂

What I haven’t quite cracked yet?

In my original deployment (pre WebApi) I was using API level caching over a couple specific endpoints. This was path based as it was for specific methods. The new API Gateway deployment directs all traffic to a {/proxy+} url in order to route any request to the routing in your WebApi. If you turn caching on here, its a bit of a race, whichever url is hit first will fill the cache for all requests. Untick!

Debugging errors locally don’t always bubble startup errors very well. I have a feeling this isn’t anything Amazon related but is something worth being aware of. E.g. if you mess up your DI, it takes some ctor null debugging to find the cause. Untick.

Summary

I was hugely impressed with WebApi integration. Once the chinks in the path based caching at the API Gateway can get ironed out I’d consider this a very good option for handling API requests.

Watch this space 🙂

Copying large files between S3 buckets

There are many different scenarios you might face where you need to migrate data between S3 buckets, and folders. Depending on the use case you have several options for the language to select.

  • Lambda’s – this could be Python, Java, JavaScript or C#
  • Bespoke code – again, this could be any language you select. To keep things different from above, lets add Powershell to the mix

Behind the scenes a lot of these SDK’s call into common endpoints Amazon host. As a user you don’t really need to delve too deeply into the specific endpoints unless you really need to.

Back to the issue at hand – copying large files
Amazon impose a limit of roughly 5GB on regular copy operations. If you use the standard copy operations you will probably hit exceptions when the file sizes grow.

The solution is to use the multipart copy. It sounds complex but all the code is provided for you:

Python
This is probably the easiest to do as the boto3 library already does this. Rather than using copy_object, the copy function already handles multipart uploads: http://boto3.readthedocs.io/en/latest/reference/services/s3.html#S3.Client.copy

C#
The C# implementation is slightly more complex however Amazon provide good worked examples: https://docs.aws.amazon.com/AmazonS3/latest/dev/CopyingObjctsUsingLLNetMPUapi.html

Powershell
A close mimic of the C# implementation – someone has ported the C# example into powershell: https://stackoverflow.com/a/32635525/1065332

Happy copying!

AlexaCore – a c# diversion into writing Alexa skills

Following the recent Amazon Prime day, I thought it was time to jump on the home assistant bandwagon – £80 seemed a pretty good deal for an Alexa Echo.

If you’ve not tried writing Alexa skills there are some really good blog posts to help get started at: http://timheuer.com/blog/archive/2016/12/12/amazon-alexa-skill-using-c-sharp-dotnet-core.aspx

Skills can be underpinned by an AWS lambda function. In experimenting with writing these I’ve started putting together some helpers which remove a lot of the boiler-plate code needed for C# Alexa Lambda functions, including some fluent tools for running unit tests.

The code and some examples are available at https://github.com/boro2g/AlexaCore. Hopefully you will find them help get your skills off the ground!

Log aggregation in AWS – part 3 – enriching the data sent into ElasticSearch

This is the third, and last part of the series that details how to aggregate all your log data within AWS. See Part 1 and Part 2 for getting started and keeping control of the size of your index.

By this point you should have a self sufficient ElasticSearch domain running that pools logs from all the CloudWatch log groups that have been configured with the correct subscriber.

The final step will be how we can enrich the data being sent into the index?

By default AWS will set you up a lambda function that extracts information from the CloudWatch event. It will contain things like: instanceId, event timestamp, the source log group and a few more. This is handled in the lambda via:

Note, a tip around handling numeric fields – in order for ElasticSearch to believe fields are numbers rather than strings you can multiply the value by 1 e.g.: source[‘@fieldName’] = 1*value;

What to enrich the data with?

This kind of depends on your use case. As we were aggregating logs from a wide range of boxes, applications and services, we wanted to enrich the data in the index with the tags applied to each instance. This sounds simple in practice but needed some planning around how to access the tags for each log entry – I’m not sure AWS would look kindly on making 500,000 API requests in 15 mins!

Lambda and caching

Lambda functions are a very interesting offering and I’m sure you will start to see a lot more use cases for them over the next few years. One challenge they bring is they are stateless – in our scenario we need to provide a way of querying an instance for its tags based of its InstanceId. Enter DynamoDb, another AWS service that provides scalable key-value pair storage.

Amazon define Dynamo as: Amazon DynamoDB is a fully managed non-relational database service that provides fast and predictable performance with seamless scalability.

Our solution

There were 2 key steps to the process:

  1. Updating dynamo to gather tag information from our running instances
  2. Updating the lambda script to pull the tags from dynamo as log entries are processed

1. Pushing instance data into Dynamo

Setup a lambda function that would periodically scan all running instances in our account and push the respective details into Dynamo.

  1. Setup a new Dynamo db table
    1. Named: kibana-instanceLookup
    2. Region: eu-west-1 (note, adjust this as you need)
    3. Primary partition key: instanceId (of type string)
      1. Note – we will tweak the read capacity units once things are up and running – for production we average about 50 
  2. Setup a new lambda function
    1. Named: LogsToElasticSearch_InstanceQueries_regionName 
    2. Add environment variable: region=eu-west-1
      1. Note, if you want this to pool logs from several regions into one dynamo setup a lambda function per region and set different environment variables for each. You can use the same trigger and role for each region
    3. Use the script shown below
    4. Set the execution timeout to be: 1 minute (note, tweak this if the function takes longer to run)
    5. Create a new role and give the following permissions:
      1. AmazonEC2ReadOnlyAccess (assign the OTB policy)
      2. Plus add the following policy:
        1. Note, the ### in the role wants to be your account id
    6. Setup a trigger within Cloudwatch -> Rules
      1. To run hourly, set the cron to be: 0 * * * ? *
      2. Select the target to be your new lambdas
        1. Note, you can always test your lambda by simply running on demand with any test event

And the respective script:

Note, if your dynamo runs in a different region to eu-west-1, update the first line of the pushInstanceToDynamo method and set the desired target region.

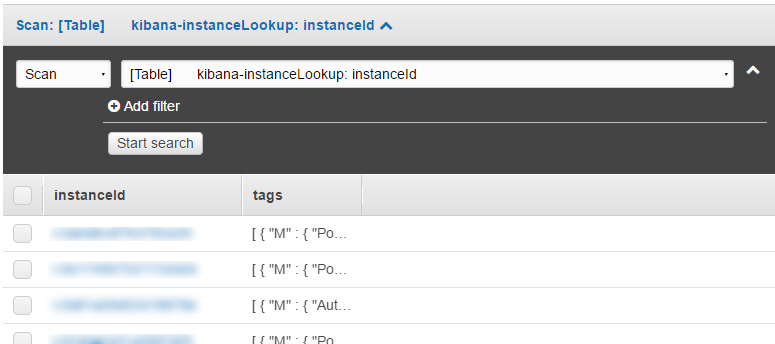
Running on demand should then fill your dynamo with data e.g.:

2. Querying dynamo when you process log entries

The final piece of the puzzle is to update the streaming function to query dynamo as required. This needs a few things:

  1. Update the role used for the lambda that streams data from CloudWatch into ElasticSearch

  2. where ### is your account id
  3. Update the lambda script setup in stage 1 and tweak as shown below

Add the AWS variable to the requires at the top of the file:

Update the exports.handler & transform methods and add loadFromDynamo to be:

The final step is to refresh the index definition within Kibana: Management -> Index patterns -> Refresh field list.

Final thoughts
There are a few things to keep an eye on as you roll this out – bear in mind these may need tweaking over time:

  • The lambda function that scans EC2 times out, if so, up the timeout
  • The elastic search index runs out of space, if so, adjust the environment variables used in step 2
  • The dynamo read capacity threshold hits its ceiling, if so increase the read capacity (this can be seen in the Metrics section of the table in Dynamo)

Happy logging!

Log aggregation in AWS – part 2 – keeping your index under control

This is the second part in the series as a follow on to /log-aggregation-aws-part-1/

Hopefully by this point you’ve now got kibana up and running, gathering all the logs from each of your desired CloudWatch groups. Over time the amount of data being stored in the index will constantly be growing so we need to keep things under control.

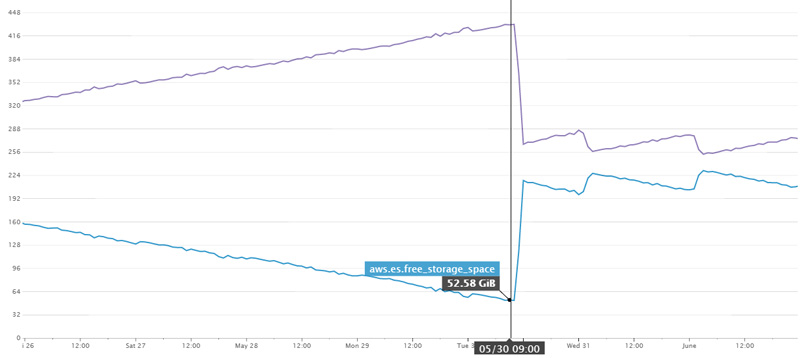
Here is a good view of the issue. We introduced our cleanup lambda on the 30th, if we hadn’t I reckon we’d have about 2 days more uptime before the disks ran out. The oscillating items from the 31st onward are exactly what we’d want to see – we delete indices older than 10 days every day.

Initially this was done via a scheduled task from a box we host – it worked but wasn’t ideal as it relies on the box running, potentially user creds and lots more. What seemed a better fit was to use AWS Lambda to keep our index under control.

Getting setup

Luckily you don’t need to setup much for this. One AWS Lambda, a trigger and some role permissions and you should be up and running.

  1. Create a new lambda function based off the script shown below
  2. Add 2 environment variables:
    1. daysToKeep=10
    2. endpoint=elastic search endpoint e.g. search-###-###.eu-west-1.es.amazonaws.com
  3. Create a new role as part of the setup process
    1. Note, these can then be found in the IAM section of AWS e.g.  https://console.aws.amazon.com/iam/home?region=eu-west-1#/roles
    2. Update the role to allow Get and Delete access to your index with the policy:
  4. Setup a trigger (in CloudWatch -> Events -> Rules)
    1. Here you can set the frequency of how often to run e.g. a CRON of

      will run at 2am every night
  5. Test your function, you can always run on demand and then check whether the indices have been removed

And finally the lambda code:

Note, if you are running in a different region you will need to tweak req.region = “eu-west-1”;

How does it work?

Elastic search allows you to query the index to find all indices via the url: /_cat/indices. The lambda function makes a web request to this url, parses each row and finds any indices that match the name: cwl-YYYY.MM.dd. If an indice is found that is older than days to keep, a delete request is issued to elasticSearch

Was this the best option?

There are tools available for cleaning up old indices, even ones that Elastic themselves provide: https://github.com/elastic/curator however this requires additional boxes to run hence the choice for keeping it wrapped in a simple lambda.

Happy indexing!