This is the third, and last part of the series that details how to aggregate all your log data within AWS. See Part 1 and Part 2 for getting started and keeping control of the size of your index.
By this point you should have a self sufficient ElasticSearch domain running that pools logs from all the CloudWatch log groups that have been configured with the correct subscriber.
The final step will be how we can enrich the data being sent into the index?
By default AWS will set you up a lambda function that extracts information from the CloudWatch event. It will contain things like: instanceId, event timestamp, the source log group and a few more. This is handled in the lambda via:
|
1 2 3 4 5 6 7 |
var source = buildSource(logEvent.message, logEvent.extractedFields); source['@id'] = logEvent.id; source['@timestamp'] = new Date(1 * logEvent.timestamp).toISOString(); source['@message'] = logEvent.message; source['@owner'] = payload.owner; source['@log_group'] = payload.logGroup; source['@log_stream'] = payload.logStream; |
Note, a tip around handling numeric fields – in order for ElasticSearch to believe fields are numbers rather than strings you can multiply the value by 1 e.g.: source[‘@fieldName’] = 1*value;
What to enrich the data with?
This kind of depends on your use case. As we were aggregating logs from a wide range of boxes, applications and services, we wanted to enrich the data in the index with the tags applied to each instance. This sounds simple in practice but needed some planning around how to access the tags for each log entry – I’m not sure AWS would look kindly on making 500,000 API requests in 15 mins!
Lambda and caching
Lambda functions are a very interesting offering and I’m sure you will start to see a lot more use cases for them over the next few years. One challenge they bring is they are stateless – in our scenario we need to provide a way of querying an instance for its tags based of its InstanceId. Enter DynamoDb, another AWS service that provides scalable key-value pair storage.
Amazon define Dynamo as: Amazon DynamoDB is a fully managed non-relational database service that provides fast and predictable performance with seamless scalability.
Our solution
There were 2 key steps to the process:
- Updating dynamo to gather tag information from our running instances
- Updating the lambda script to pull the tags from dynamo as log entries are processed
1. Pushing instance data into Dynamo
Setup a lambda function that would periodically scan all running instances in our account and push the respective details into Dynamo.
- Setup a new Dynamo db table
- Named: kibana-instanceLookup
- Region: eu-west-1 (note, adjust this as you need)
- Primary partition key: instanceId (of type string)
- Note – we will tweak the read capacity units once things are up and running – for production we average about 50
- Setup a new lambda function
- Named: LogsToElasticSearch_InstanceQueries_regionName
- Add environment variable: region=eu-west-1
- Note, if you want this to pool logs from several regions into one dynamo setup a lambda function per region and set different environment variables for each. You can use the same trigger and role for each region
- Use the script shown below
- Set the execution timeout to be: 1 minute (note, tweak this if the function takes longer to run)
- Create a new role and give the following permissions:
- AmazonEC2ReadOnlyAccess (assign the OTB policy)
- Plus add the following policy:
-
12345{"Effect": "Allow","Action": "dynamoDb:*","Resource": "arn:aws:dynamodb:eu-west-1:###:table/kibana-instanceLookup"}
- Note, the ### in the role wants to be your account id
- Setup a trigger within Cloudwatch -> Rules
- To run hourly, set the cron to be: 0 * * * ? *
- Select the target to be your new lambdas
- Note, you can always test your lambda by simply running on demand with any test event
And the respective script:
|
1 2 3 4 5 6 7 8 9 10 11 12 13 14 15 16 17 18 19 20 21 22 23 24 25 26 27 28 29 30 31 32 33 34 35 36 37 38 39 40 41 42 43 44 45 46 47 48 49 50 51 52 53 54 55 56 57 58 59 60 61 62 63 64 65 66 67 68 69 70 71 72 73 74 75 76 77 78 79 80 81 82 83 84 85 86 87 88 89 90 91 92 93 94 95 96 97 98 99 100 101 102 103 104 105 |
var AWS = require("aws-sdk"); var tableName = 'kibana-instanceLookup'; exports.handler = function (input, context) { AWS.config.update({ region: process.env.region }); this._ec2 = new AWS.EC2(); var queryParams = { MaxResults: 200 }; var instances = []; this._ec2.describeInstances(queryParams, function (err, data) { if (err) console.log(err, err.stack); else { data.Reservations.forEach((r) => { r.Instances.forEach((i) => { instances.push({ "instanceId": i.InstanceId, "tags": i.Tags }); }); }); console.log(JSON.stringify(instances)); instances.forEach((instance) => { pushInstanceToDynamo(instance); }); } }); function pushInstanceToDynamo(instance) { AWS.config.update({ region: 'eu-west-1' }); var params = { Key: { "instanceId": { S: instance.instanceId } }, TableName: tableName }; new AWS.DynamoDB().getItem(params, function (err, data) { if (err) { console.log(err, err.stack); } else { if (data.Item) { console.log("Item found in dynamo - not updating " + instance.instanceId); } else { var tags = {}; tags.L = []; instance.tags.forEach((tag) => { if (tag.Key.indexOf("aws:") === -1) { tags.L.push(buildArrayEntry(tag)); } }); var insertParams = { Item: { "instanceId": { S: instance.instanceId }, "tags": tags }, ReturnConsumedCapacity: "TOTAL", TableName: tableName }; new AWS.DynamoDB().putItem(insertParams, function (err, data) { if (err) console.log(err, err.stack); else console.log(data); }); } } }); } function buildArrayEntry(tag) { var m = {}; m[tag.Key] = { "S": tag.Value }; return { "M": m }; } } |
Note, if your dynamo runs in a different region to eu-west-1, update the first line of the pushInstanceToDynamo method and set the desired target region.
Running on demand should then fill your dynamo with data e.g.:
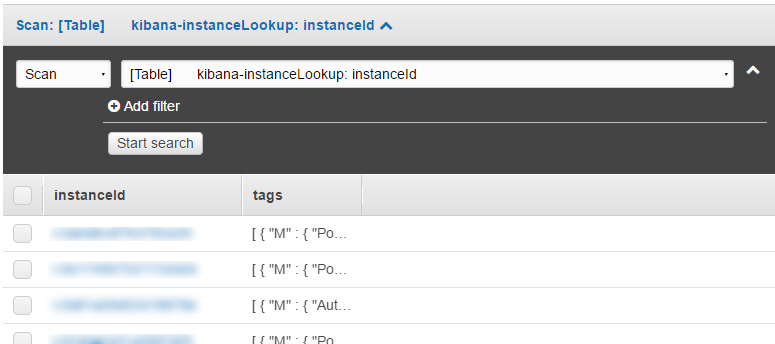
2. Querying dynamo when you process log entries
The final piece of the puzzle is to update the streaming function to query dynamo as required. This needs a few things:
- Update the role used for the lambda that streams data from CloudWatch into ElasticSearch
-
12345{"Effect": "Allow","Action": "dynamodb:GetItem","Resource": "arn:aws:dynamodb:eu-west-1:###:table/kibana-instanceLookup"}
where ### is your account id - Update the lambda script setup in stage 1 and tweak as shown below
Add the AWS variable to the requires at the top of the file:
|
1 |
var AWS = require("aws-sdk"); |
Update the exports.handler & transform methods and add loadFromDynamo to be:
|
1 2 3 4 5 6 7 8 9 10 11 12 13 14 15 16 17 18 19 20 21 22 23 24 25 26 27 28 29 30 31 32 33 34 35 36 37 38 39 40 41 42 43 44 45 46 47 48 49 50 51 52 53 54 55 56 57 58 59 60 61 62 63 64 65 66 67 68 69 70 71 72 73 74 75 76 77 78 79 80 81 82 83 84 85 86 87 88 89 90 91 92 93 94 95 96 97 98 99 100 101 102 103 104 105 106 107 108 109 110 111 112 113 114 115 116 117 118 119 120 121 122 123 124 125 126 127 128 129 130 131 132 133 134 135 136 137 138 139 140 141 142 143 144 145 146 147 148 149 |
exports.handler = function (input, context) { this._dynamoDb = new AWS.DynamoDB(); // decode input from base64 var zippedInput = new Buffer(input.awslogs.data, 'base64'); // decompress the input zlib.gunzip(zippedInput, function (error, buffer) { if (error) { context.fail(error); return; } // parse the input from JSON var awslogsData = JSON.parse(buffer.toString('utf8')); // transform the input to Elasticsearch documents transform(awslogsData, (elasticsearchBulkData) => { // skip control messages if (!elasticsearchBulkData) { console.log('Received a control message'); context.succeed('Control message handled successfully'); return; } // post documents to the Amazon Elasticsearch Service post(elasticsearchBulkData, function (error, success, statusCode, failedItems) { console.log('Response: ' + JSON.stringify({ "statusCode": statusCode })); if (error) { console.log('Error: ' + JSON.stringify(error, null, 2)); if (failedItems && failedItems.length > 0) { console.log("Failed Items: " + JSON.stringify(failedItems, null, 2)); } context.fail(JSON.stringify(error)); } else { console.log('Success: ' + JSON.stringify(success)); context.succeed('Success'); } }); }); }); }; function transform(payload, callback) { if (payload.messageType === 'CONTROL_MESSAGE') { return null; } var bulkRequestBody = ''; var instanceId = payload.logStream; if (instanceId.indexOf(".") > -1) { instanceId = instanceId.substring(0, instanceId.indexOf(".")); } loadFromDynamo(instanceId, (dynamoTags) => { payload.logEvents.forEach(function (logEvent) { var timestamp = new Date(1 * logEvent.timestamp); // index name format: cwl-YYYY.MM.DD var indexName = [ 'cwl-' + timestamp.getUTCFullYear(), // year ('0' + (timestamp.getUTCMonth() + 1)).slice(-2), // month ('0' + timestamp.getUTCDate()).slice(-2) // day ].join('.'); var source = buildSource(logEvent.message, logEvent.extractedFields); source['@id'] = logEvent.id; source['@timestamp'] = new Date(1 * logEvent.timestamp).toISOString(); source['@message'] = logEvent.message; source['@owner'] = payload.owner; source['@log_group'] = payload.logGroup; source['@log_stream'] = payload.logStream; var action = { "index": {} }; action.index._index = indexName; action.index._type = payload.logGroup; action.index._id = logEvent.id; bulkRequestBody += [ JSON.stringify(action), JSON.stringify(Object.assign({}, source, dynamoTags)) ].join('\n') + '\n'; }); callback(bulkRequestBody); }); } function loadFromDynamo(instanceId, callback) { var tagsSource = {}; try { var params = { Key: { "instanceId": { S: instanceId } }, TableName: "kibana-instanceLookup" }; this._dynamoDb.getItem(params, function (err, data) { if (err) { console.log(err, err.stack); callback(tagsSource); } else { if (data.Item) { data.Item.tags.L.forEach((tag) => { var key = Object.keys(tag.M)[0]; tagsSource['@' + key] = tag.M[key].S; }); } callback(tagsSource); } }); } catch (exception) { console.log(exception); callback(tagsSource); } } |
The final step is to refresh the index definition within Kibana: Management -> Index patterns -> Refresh field list.
Final thoughts
There are a few things to keep an eye on as you roll this out – bear in mind these may need tweaking over time:
- The lambda function that scans EC2 times out, if so, up the timeout
- The elastic search index runs out of space, if so, adjust the environment variables used in step 2
- The dynamo read capacity threshold hits its ceiling, if so increase the read capacity (this can be seen in the Metrics section of the table in Dynamo)
Happy logging!