AWS Lambda’s are a great replacement for things like Windows Services which need to run common tasks periodically. A few examples would be triggering scheduled backups or polling urls.
You can set many things as the trigger for a lambda, for scheduled operations this can be a CRON value triggered from a CloudWatch event. Alternatively lambda’s can be triggered via a subscription to an SNS topic.
Depending on the type of operation you want to perform on a schedule you might find it takes longer than the timeout restriction imposed by AWS. If that’s the case then a simple PUB SUB (publisher, subscriber) configuration should help.
Sample scenario
We want to move databases backups between 2 buckets in S3. There are several databases to copy, each of which being a large file.
In one lambda you can easily find all the files to copy but if you also try to copy them all at some point your function will timeout.
Pub sub to the rescue
Why not setup 2 lambda functions? One as the publisher and one as the subscriber, and then glue the two together with an SNS topic (Simple Notification Service)
The publisher
Typically this would be triggered from a schedule and would look to raise events for each operations. Lets assume we use a simple POCO for converying the information we need:
|
1 2 3 4 |
class UrlRequestMessage { public string[] Urls {get;set;} } |
|
1 2 3 4 5 6 7 8 9 10 11 12 13 14 15 16 17 18 19 20 21 22 23 24 |
public class Function { public string FunctionHandler(object input, ILambdaContext context) { //This could gather urls to poll from a file, db or anywhere var urlsToScan = LoadUrls(); var snsClient = new AmazonSimpleNotificationServiceClient(); int batchSize = 4; context.Logger.LogLine($"Batch size: {batchSize}"); foreach (var urlToScan in urlsToScan.Batch(batchSize)) { snsClient.PublishAsync("topic arn e.g. arn:aws:sns:eu-west-1:98976####:UrlPoller_Topic", JsonConvert.SerializeObject(new UrlRequestMessage {Urls = urlToScan.ToArray()})).Wait(); context.Logger.LogLine($"Raised event for urls: {String.Join(" | ", urlToScan)}"); } return "ok"; } } |
The batching can be ignored if needs be – in this scenario this allows multiple urls to be handled by one subscriber.
The subscriber
Next we need to listen for the messages – you want to configure the subscriber function to have an SNS trigger that uses the same topic you posted to before.
|
1 2 3 4 5 6 7 8 9 10 11 12 13 14 15 16 17 18 19 |
public class Function { public string FunctionHandler(SNSEvent message, ILambdaContext context) { foreach (var record in message.Records) { var decodedMessage = JsonConvert.DeserializeObject<UrlRequestMessage>(record.Sns.Message); foreach (var url in decodedMessage.Urls) { //here you just need to implement your logic for polling a url // e.g. var result = new WebClient().DownloadStringTaskAsync(url).Result; var requestSummary = RequestUrl(url, context.Logger); } } return "OK!"; } } |
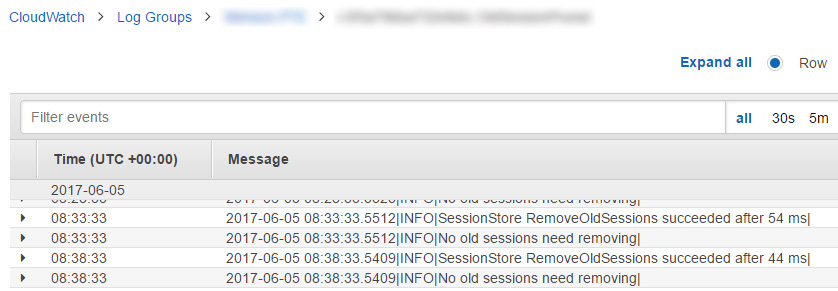
Debugging things
You can either run each function on demand and see any output directly in the Lambda test window, or dig into your cloudwatch logs for each function.