I’ve recently been trying to explain the life of a developer to my fiance, in particular the recent work we’ve been doing around load testing xDB. She suggested a rather apt metaphor for the problem: tummy pants – you prod and poke one area, then another starts to bulge.
Female fashion aside the metaphor feels rather accurate, especially as you add more components to a system. Lets consider the evolution of Sitecore. Originally you had a relatively simple model: sql servers and web servers. Since the advent of xDB this landscape shifts – you now need to consider things like: mongo, shared/private session, solr, reporting services, aggregation services, the list goes on.
Recently we’ve been through a long phase of load testing – the primary focus: can we get personalized content to the customer quickly and reliably? In short, yes – but it took a lot of test runs to get there! Sitecore have a white paper on load testing they ran, it’s worth having a read: https://doc.sitecore.net/White_papers
The goal:
The client in question has a really good track record of focusing on key parts of the development lifecycle such as load testing – their main sales outlet is the web so keeping online customers happy is rather high on their list of priorities. Based on this we often have a load test phase prior to deploying new applications or even when new features are added to the existing code base.
We had a clear target to achieve based on their existing online profile: 250 transactions per second with average response times sub 2s. There were more non-functional requirements but for the scope of this post they aren’t really important.
The setup:
All the testing was performed against boxes hosted in AWS. The load tests were run via 2 means, custom AWS boxes running jMeter and VS Online Load Tests. We had control over the VS tests, an external company was running the jMeter tests – this allowed us to quickly iterate our approach and finally get sign off once we were happy with our setup.
For AWS box specs have a look at https://aws.amazon.com/ec2/instance-types/. Its worth noting we are looking to trim back the sizes of each – now we’ve achieved the target we can simplify and tune back specs and therefore cost.
- Web boxes: 3 / 5 / 7 web boxes – c4.2xlarge
- Sql boxes: 1 (for core, master, web, session) – c4.2xlarge
- xDB cluster: 3 – i2.xlarge linux
- Mongo configured to use wiredTiger. When mmap1 was used we’d see large numbers of collection locks during test runs.
- This was all monitored via New Relic via their free 24hr retention account
How did we get on?
Initially pretty badly! We’d see stable response times under light load but as soon as we started to move up the load ramps this would quickly tail off – graphs would look a lot like:
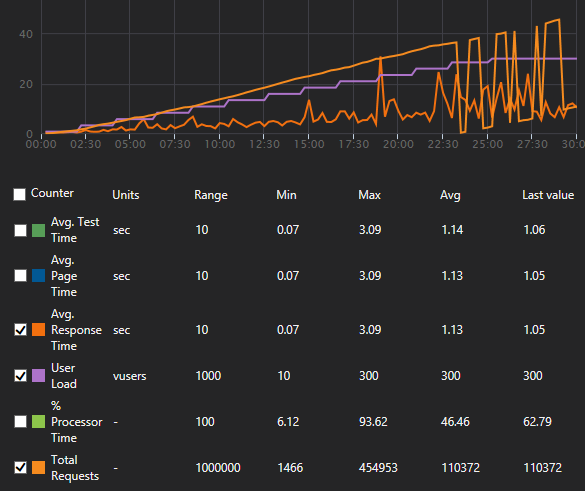
The overall average response times were ok but things really started to tail off towards the end.
Where did we get to?
By the end things were much rosier, we could get a lot more stable response times right through the test ramps. Note the number of requests we managed to handle between the 2 runs:
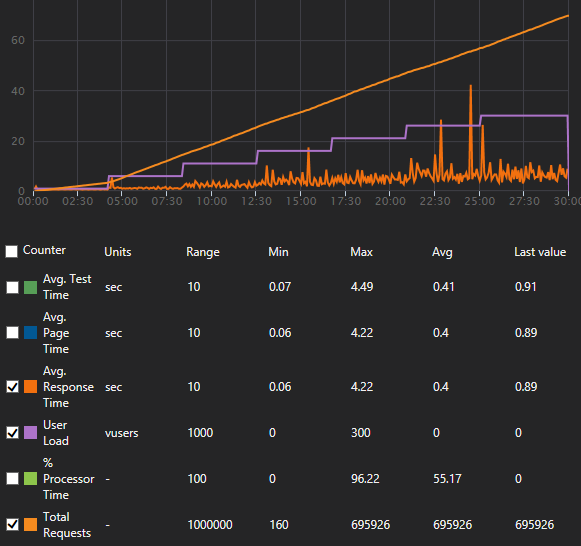
Now it’s worth noting, we could perform the same test twice and get variations in results. Please don’t use the exact figures as gospel, they are more to indicate the improvements we managed to achieve – avg response times halved! 🙂
Tummy pants?!?!
We ran several iterations of tests against different spec boxes, and combinations of boxes. Quite a common issue we’d find would be you scale up one aspect which then moves the bottleneck elsewhere. More web boxes wouldn’t necessarily buy you better results, bigger mongo boxes (even with promises of vast quantities of iops) may have little marked effect. We prodded one area and the problem appeared to move around.
How did we achieve the improvement?
It took a combination of a few things: some help and guidance from the guys at Sitecore that were involved in the load testing shown in the white paper listed above and some reconfiguration of the setup.
As we tweaked the setup one area that remained unclear was the way the linux boxes were handling each collection. Mongo allows you to create your own collections, in the Sitecore model things like analytics. It also maintains its own collections for things like replication. The wiredTiger storage engine is I/O heavy on the disk as documents are pulled to and from the disk when updates are issued.
In order to measure and tweak exactly what mongo was doing we made a few changes:
- Turned on https://docs.mongodb.org/manual/reference/configuration-options/#storage.directoryPerDB
- Added new disks per collection
- One for local and then each collection Sitecore uses. Note you could group some of these so that more than one collection shares a drive – this depends on your requirements and your own testing.
- For content delivery performance the key one to isolate is the analytics collection.
- Formatted new disks as xfs and then mounted in place per collection.
- Tuned the iops per collection
Prior to making these changes I had little experience of working with linux. It took a while, and a fair amount of googling to find the best resources. There are some good tools to help get going: putty and winscp.
Tuning the changes
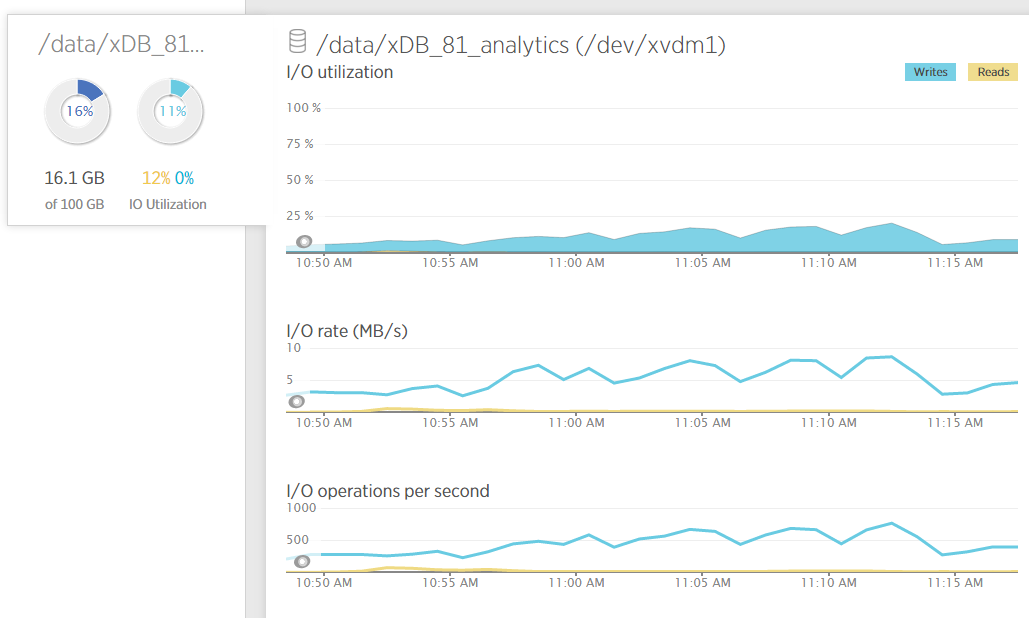
New relic proved invaluable when diagnosing each disk’s resource usage. The next step for us will be to reduce the pre-allocated iops assigned to each collection so it suits the details below.
tl:dr;
When you load test a system it’s key to get a clear picture of what is going on. Tools like New Relic are great for aggregating the performance of different components. That holds true for both windows and linux installs.
For your Mongo instances assigning different performance to each collection will give you much better visibility and much more fine grained control over each collection. In our testing this resulted in halving our average response times.